Chloropleth Mapping
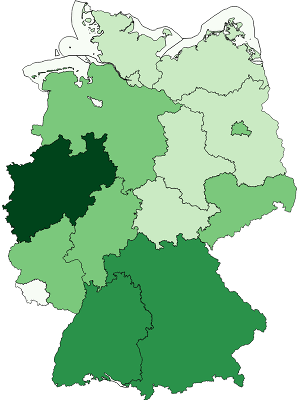
◼ 0.00 - 990718.00
◼ 990718.00 - 2815955.00
◼ 2815955.00 - 7790559.00
◼ 7790559.00 - 12604244.00
◼ 12604244.00 - 17571856.00
A Chloropleth [/ˈklôrəˌpleTH/] map is a map showing areas colored by their value.
A typical use-case is the display of absolute values such as the number of inhabitants (a “population map”) or cars within each area.
Chloropleth maps are also commonly used for nominal values, such as a map of political regions, each colored distinctively.
The name is derived from Ancient Greek χλωρός (khlōrós, “pale green”) and πλῆθος (plêthos, “multitude”).
As Wikipedia says, this technique provides an easy way to visualize how a measurement varies across a geographic area or it shows the level of variability within a region.1
As showcased by the example map on the right, chloropleth maps usually employ a greenish color scale (hence the name!).
When used erroneously with a reddish color scale, this technique is also known as “heatmap”.